It is often assumed that the Glorious Revolution settled these crucial questions in favor of a sovereign and effectively “modern” Parliament. Dynasticism, if it figures into the picture at all, is supposed to have disappeared as a meaningful political principle then or shortly thereafter.
—Julia Adams (2005, p. 181)
How common are democratic dynasties around the world, and how does Japan compare? The main purpose of this chapter is to give a descriptive overview of the empirical record using the two original quantitative datasets that will be used throughout the book. In so doing, the chapter has three aims. The first is to situate the case of Japan in a broader comparative context and highlight some of the puzzles in the aggregate variation in dynastic politics across countries, parties, and time. The second aim is to explore the empirical patterns in Japan, particularly with regard to the demographic qualities and backgrounds of legacy versus non-legacy candidates, to establish that these patterns provide insufficient insight into the sources of Japan’s high level of dynastic politics. Finally, the third aim is to demonstrate that alternative theories based on history or culture do not provide credible explanations for the empirical differences between Japan and other democracies.
The first dataset is the MP-level comparative panel dataset covering twelve democracies: Australia, Canada, Finland, Germany, Ireland, Israel, Italy, Japan, New Zealand, Norway, Switzerland, and the United States (Dynasties in Democracies Dataset). Some of the country cases include observations beginning with the first crop of MPs elected following democratization. Others include only MPs elected in recent decades but nevertheless measure dynastic family ties to MPs from prior years. Where relevant, relationships to members of earlier parliamentary bodies, such as the US Continental Congress and other such constituent assemblies, are included. This dataset will be used primarily in this chapter to highlight patterns in the cross-national, cross-party, and cross-temporal prevalence of democratic dynasties, and to put the case of Japan in comparative perspective.
The second dataset is the candidate-level panel dataset for Japan (JHRED) that covers all candidates for the House of Representatives from 1947 to 2014, and includes their electoral records, personal backgrounds and family relations, and postelectoral appointments to cabinet. This more detailed dataset forms the backbone of the main analyses in the remainder of the book. The data presentations in this chapter highlight some of the aggregate patterns over time and space, and across parties. In addition, this chapter provides the basic descriptive information on the types of family relationships and number of generations within dynasties in Japan.
Measuring the Dynastic Ties of Politicians
One of the greatest obstacles to comparative research on dynastic politics is the scarcity of reliable data on family ties between politicians. In part, this is because obtaining individual-level data on candidates and MPs in general has been a challenge for researchers. However, historical MP-level data for an increasing number of democracies are becoming available, often in the form of freshly digitized records of parliamentary libraries. A few such data sources also code family relations between members. For example, the websites of the Israeli Knesset (parliament) and Canadian House of Commons include family ties to previous MPs among other background and career information in online biographical profiles of current and former MPs—and these records are available in English (as well as Hebrew in the Israeli case and French in the Canadian case). Similar information is available in the online biographies of historical MPs in Finland and Norway, but only in the local language.
Where official biographical information on family ties is not already digitally available, data measurement is a greater challenge because legacy candidates and MPs must be intensively coded by hand using archival material from newspapers, candidate websites, historical biographical dictionaries, census records, and other sources. In contrast to more common variables related to a candidate’s background (e.g., gender, date of birth, electoral constituency, prior experience), dynastic family ties can be difficult to find and verify, and are not consistently recorded by the governments or parties of all countries. This is especially true for candidates who are not successful in getting elected. The lack of availability of reliable data may thus introduce some selection bias into any sample of countries used for comparative research on dynasties. For example, if it is difficult to find any information on family ties among politicians in a given country, it could be because the data are poor, or because such ties are simply uncommon. Thus, when the data sample is limited to countries where information on family ties of MPs is obtainable, the patterns that emerge may overlook some important cross-national variation.
A few previous studies have cleverly attempted to get around the scarcity of verified information on family ties by matching politicians based on common surnames within a constituency or party in order to estimate a proxy measure of dynastic ties (e.g., Querubín, 2016; Geys, 2017). However, this method inevitably introduces some amount of measurement error. On the one hand, it may produce some false positives—that is, two or more individuals who share a name but are not related. Common surnames must often therefore be thrown out so as not to overestimate the number of dynasties. On the other hand, the proxy method may also produce false negatives. A legacy candidate might not always share the same name or run in the same district or from the same party. Moreover, unless the entire time span of a country’s democratic experience is included in the sample, some anterior relatives will not be observable. Nevertheless, even verified family ties from official biographies may overlook less obvious relationships, so few comparative datasets are likely to be completely free of such measurement error.
Keeping these data limitations in mind, a comparative cross-national look at democratic dynasties is still useful as a starting point for investigating the phenomenon, and to put the case of Japan in perspective. For the purpose of cross-national comparison, the focus here is on legacy MPs in the lower chamber of each country. Each of the countries in the dataset either is coded on the basis of official biographical data provided by the respective parliamentary libraries or intensive coding by hand based on verifiable ties in archival records, biographical dictionaries, and any other credible source that could be obtained.
Recall that a legacy MP is any individual who is related by blood or marriage to a national-level politician (an elected or appointed MP in either legislative chamber in bicameral systems, as well as presidents, vice presidents, or non-MP cabinet ministers, if applicable) who preceded him or her in office. This definition does not count individuals related only to local-level politicians, although such individuals are also common across most cases, including Japan. In part, this definitional restriction is because obtaining complete information on local-level family ties is even more of a challenge than obtaining information on ties between national-level politicians.1 The measurement of who counts as a legacy MP also excludes relations to deputy or substitute MPs (which are common in list-based systems such as Norway and Italy) unless they actually served in parliament. Finally, the measure does not count members who were related to each other but who were both elected for the first time in the same year (as sometimes occurs with married couples or siblings). Each MP in the comparative dataset is coded to indicate whether he or she preceded a family member into national-level political office (a “senior”) and whether he or she succeeded a family member into national-level political office (a “junior”). In addition, the comparative data include information on number of terms served, gender, age, party, district, and cabinet service, but these variables are not available for all cases.
The Comparative Empirical Record
The “snapshot” cross-sectional differences presented in the previous chapter are illuminating but mask some of the variation that can be present within countries across time, as well as across parties. Aggregate variation across democracies can be affected by a number of factors, including population size, economic inequality, occupational mobility, legislator turnover, age of democracy, or institutional variation across districts. For example, the supply of qualified non-legacy candidates will likely be higher in an economically developed country with a large population than in very small or poor countries. The nature of dynastic politics in younger democracies like Israel may also look different if observed several decades from now. A few countries in the sample, including Japan, but also Italy and New Zealand, have experienced electoral reforms, and many others have experienced changes in the party system. The impact of such changes cannot be identified in cross-sectional comparisons of aggregate data. It is thus informative to look at how dynastic politics have developed over time in these different democracies, as well as whether there are notable differences across parties.
COMPARATIVE PATTERNS ACROSS TIMEFigure 2.1 illustrates the longitudinal patterns in the proportion of dynasties in the lower chamber of the twelve democracies in the comparative dataset. The oldest democracy in the world, the United States, is also the oldest democracy in the dataset; and dynasties have long captured the attention of scholars and observers of American politics.2 America’s first dynasty, the Adams family, spanned four generations—including President John Adams and his son President John Quincy Adams—and played a leading role in American politics for nearly two centuries. Other dynasties, such as the Roosevelts and Kennedys, are also well known. Some high-profile legacy politicians have served in executive office in recent decades, including President George W. Bush (whose father, George H. W. Bush, had served in the House of Representatives prior to serving as president himself, and whose grandfather, Prescott Bush, served in the Senate) and Vice President Al Gore (who succeeded his father, Albert Gore Sr., in the same district for the House of Representatives as well as the Senate). As Stephen Hess (1966, p. 1) notes, despite the US Constitution’s declaration that “no title of nobility shall be granted by the United States,” Americans have consistently returned members of democratic dynasties to office.
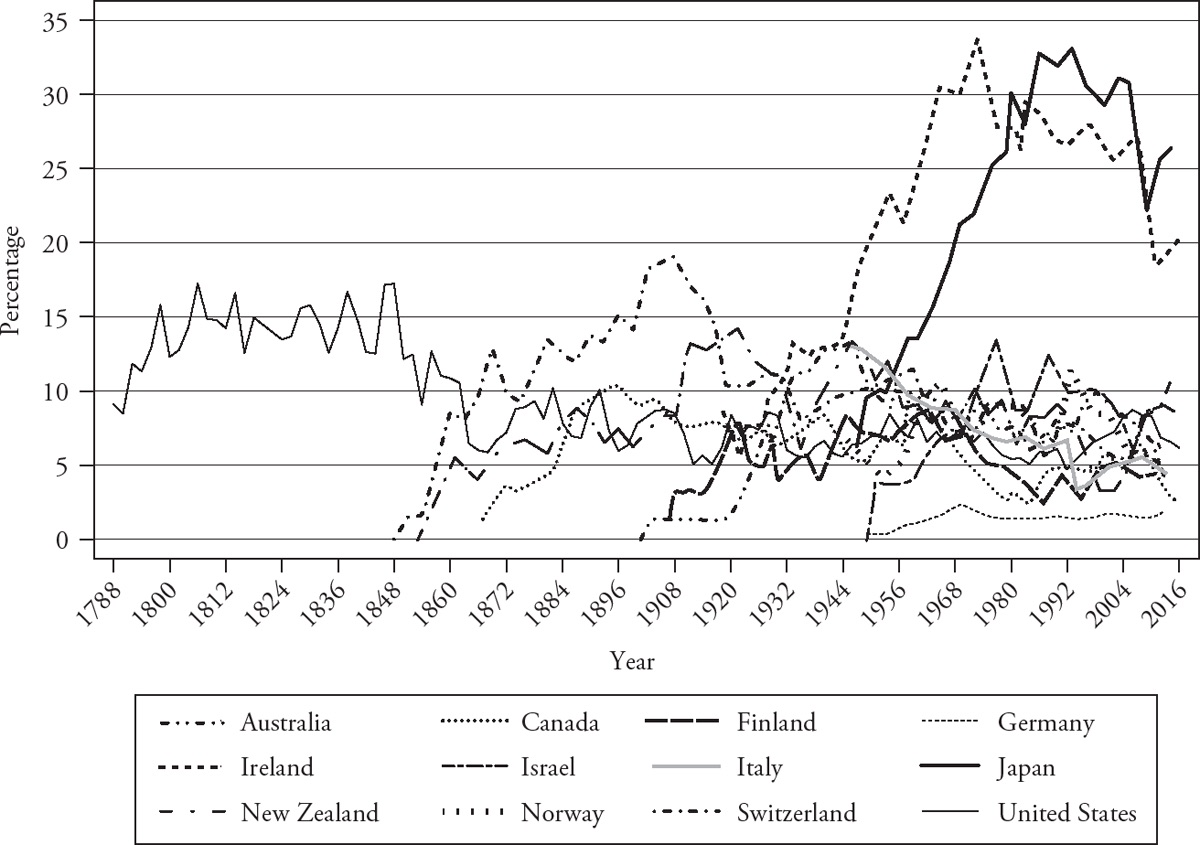
Nevertheless, the general pattern in Congress has been a decrease in dynasties over time. In the House of Representatives, dynastic membership reached a peak of just over 17 percent after the 1848 election. In the past two decades, however, only 7 percent of members, on average, have been part of a dynasty.3 The 115th House of Representatives elected in 2016 included twenty-seven legacy members (6 percent). The decline in dynasties occurred more slowly in the South than in other regions (Dal Bó, Dal Bó, and Snyder, 2009), but today there is not much of a regional difference in the phenomenon. Alfred B. Clubok, Norman M. Wilensky, and Forrest J. Berghorn (1969, p. 1062) conclude that the decline in American dynasties over time was likely the result of “political modernization” rather than factors such as population growth or social change.
For six other countries in the comparative dataset, long-term longitudinal data going back to the first legislative session after democratization or independence are also available. The second oldest democracy in the dataset is Switzerland, with observations commencing with the members of the National Council elected at the 1848 federal election. For the New Zealand House of Representatives, the data begin with members of the first parliament, elected in 1853. The data for the Canadian House of Commons similarly go back to the first federal elections, held in 1867. The data for Finland go back to 1907, the first parliamentary election with universal suffrage following the establishment of the Eduskunta (parliament). For Australia, the data cover all MPs since the inaugural House of Representatives, elected in 1901. Finally, in the case of Ireland, the data commence with the MPs elected from Ireland to the House of Commons of the United Kingdom in 1918. In that election, MPs from the nationalist Sinn Féin (SF) party refused to take their seats, and instead established the first Dáil (parliament) of what would eventually become an independent Republic of Ireland.
As in the United States, the general pattern in most of these democracies is an initial increase in the proportion of legacy MPs as some of the first generation of MPs leave the political scene and are succeeded in politics by family members. This initial increase is then followed by a gradual decrease in the proportion of legacy MPs over time. However, these seven cases differ from one another in the level at which dynasties peak (what we might call the “ceiling” of dynastic politics), as well as the level at which they eventually stabilize (what we might call the “floor”). For the United States, the ceiling was 17 percent. This is slightly higher than the ceilings for Australia (13 percent in the 1940s) and New Zealand (14 percent in 1922), and much higher than in Canada (11 percent in 1896) and Finland (9 percent in 1962). However, it is slightly lower than the ceiling in Switzerland (19 percent in 1908) and much lower than the ceiling in Ireland (34 percent in 1973).
There is also notable variation in the floor for each of these countries. The proportion of legacy MPs in Australia has not exceeded 10 percent since 1963. It has been at 6 percent or less since 1968 in Canada, and since 1972 in Finland. New Zealand witnessed a brief drop in the proportion of legacy MPs in the late 1990s and early 2000s—possibly as a result of electoral reform in 1993—but has since rebounded to its postwar “norm” of roughly 8–10 percent. The decline in dynasties in Switzerland began to pick up pace around the time that the country adopted a PR system (for most elections) in 1918. The proportion of legacy MPs has not exceeded 10 percent since 1963 and has fluctuated between 5 percent and 7 percent since the 1980s. In contrast, Ireland maintained a relatively stable floor of between 25 percent and 30 percent of members until the 2011 general election, when the dominant Fianna Fáil (FF) party was decimated at the polls following the world financial crisis. Even so, at 20 percent, the proportion of dynasties in the Irish Dáil after the most recent election in 2016 exceeds the ceiling proportions for the six other cases.
Although not included in the comparative dataset, similar patterns have been documented in the development of dynastic politics over time in the United Kingdom (van Coppenolle, 2017). The proportion of legacy MPs in the House of Commons was well over 30 percent in the late 1880s, two hundred years after the Glorious Revolution brought an end to the absolute political power of the monarchy. However, the proportion steadily declined over time and has been less than 10 percent since the 1950s. In the 55th House of Commons, elected in 2010, roughly 8 percent of MPs were political legacies.4 Some notable legacy MPs include former Labour Party leader Ed Miliband, who followed his brother David Miliband into parliament; the former Conservative prime minister David Cameron, whose great-grandfather was Sir William Arthur Mount, a Conservative MP in the early 1900s; and Conservative MP Nicholas Soames, who is the grandson of Sir Winston Churchill. Another Labour MP, Stephen Kinnock, is the son of former Labour leader Neil Kinnock and also the husband of former Danish prime minister Helle Thorning-Schmidt. There has been some media speculation that Euan Blair, the son of former Labour prime minister Tony Blair, might also run for parliament in the future.5
Thus, with the exception of Ireland, the general pattern in the democracies for which long-term data are available is a gradual decline over time in the prevalence of dynasties, but with varying ceilings and floors. For the remainder of the country cases in the comparative dataset, observations are available only for MPs elected since 1945, so we cannot paint as complete of a picture of each country’s development, except for the case of Israel, where this time period covers the complete history of the Knesset. For all other cases, relationships to pre-1945 MPs are included in the measurement of legacy MPs, but the pre-1945 MPs themselves are not included as observations. For the case of Germany, only MPs from West Germany are included prior to reunification, but relationships to former East German politicians are counted for the purpose of coding legacy MPs in the post-reunification period.
For four of these countries, the proportion of legacy MPs does not exceed 15 percent in any legislature for which data are available. In Germany, the proportion of legacy MPs in the Bundestag (parliament) has never exceeded 2 percent, and many of those who have served came from long-active noble families. One recent example is Carl-Eduard von Bismarck, who is the great-great-grandson of Otto von Bismarck, the first German chancellor, and grandson of Prince Otto Christian Archibald von Bismarck, a member of the Nazi Party in the prewar period and an MP for the Christian Democratic Union (CDU) after the war.
In Israel, the percentage of legacy MPs in the Knesset peaked at 13 percent in 1977, and has since dropped to less than 10 percent throughout the 2000s. The 20th Knesset, elected in 2015, contained eleven legacy MPs (9 percent). One example is Tzipi Livni, leader of Kadima until 2012, who is the daughter of three-term former MP Eitan Livni. She later became leader of Hatnuah and formed the Zionist Union (ZU) together with Labor Party leader Isaac Herzog. Herzog is the son of Chaim Herzog, the sixth president of Israel and a former MP. In addition, Chaim Herzog was a brother-in-law to former MP Abba Eban. The son of former prime minister Ariel Sharon, Omri Sharon, served in the Knesset from 2003 to 2006, until he was convicted of fraud and sent to prison.
The proportion of legacy MPs in the Italian Chamber of Deputies has also declined steadily over time, dropping to a low of 3 percent in 1994, after a number of members became embroiled in the Tangentopoli corruption scandal that brought down the long-ruling Christian Democrats (DC) and ushered in electoral system reform. Nevertheless, many political families are still active in Italian politics, with the proportion in recent parliaments at roughly 5 percent. For example, Bobo and Stefania Craxi (brother and sister) are the children of former prime minister Bettino Craxi of the Italian Socialist Party (PSI). The granddaughter of Benito Mussolini, Alessandra Mussolini, began her career in the neo-fascist Italian Social Movement (MSI) and later affiliated herself with former prime minister Silvio Berlusconi’s People of Freedoms (Il Popolo della Libertà, PdL) conservative alliance. Dynasties have been documented in local-level Italian politics as well (Chirico and Lupoli, 2008; Geys, 2017).
In the Norwegian Storting (parliament), the proportion of legacy MPs has fluctuated between 5 percent and 10 percent for most of the period from 1945 to 2013 (Fiva and Smith, 2018). The MPs elected in 2013 included eleven legacies (7 percent), including former Labour Party prime minister Jens Stoltenberg, who is the son of former cabinet minister Thorvald Stoltenberg. Prior to Stoltenberg, the prime minister’s office was held by Kjell Magne Bondevik of the Christian Democratic Party (Kristelig Folkeparti, KrF), whose uncle Kjell Bondevik was also a former MP, cabinet minister, and party leader. Of the fourteen prime ministers to serve between 1945 and 2016, four had dynastic family ties to former politicians, and five had family members who followed them into national politics.
How does Japan compare to the other countries in the comparative dataset? One aspect of Japan’s experience that immediately stands out is the steep upward trend for most of the period under investigation. Unlike most of the other countries in the comparative dataset, Japan witnessed a steady increase in the proportion of legacy MPs in the House of Representatives over time, with the ceiling to the level of dynastic membership—33 percent in 1993—higher than all other countries except Ireland. Indeed, Ireland appears most similar to Japan in terms of dynastic politics. All other countries’ trend lines blend together in the lower part of Figure 2.1, rarely exceeding 10 percent over the entire post-1945 period.
In 1947, the proportion of legacy MPs in Japan was just 6 percent—near the average for most other countries but the absolute lowest level for postwar Japan. However, the proportion of legacy MPs proceeded to grow steadily throughout the following three decades, as incumbents retired or died and were succeeded by family members. The proportion plateaued in the 1980s and 1990s at just above 30 percent, then dropped precipitously in 2009 before making a slight rebound in the 2012 and 2014 general elections. As with Ireland in 2011, the sharp drop in legacy MPs in 2009 can be explained by a shift in the party composition of the legislature following the DPJ’s defeat of the LDP in that election. Such drastic swings due to changes in parties’ seat shares highlight the need to look more closely at differences across parties within countries.
COMPARATIVE PATTERNS ACROSS PARTIESThe longitudinal trends reveal interesting aggregate patterns in the development of dynasties over time in each of the twelve democracies in the comparative dataset. However, there are also significant differences in the proportion of legacy MPs across parties, and these differences could in part be responsible for fluctuations in the aggregate proportion if the party composition of the legislature changes. Because changes in party systems and changes in specific parties’ names over time can quickly become complicated to track longitudinally—especially in the multiparty systems of Israel and Italy—here the presentation will focus only on cross-sectional differences in pooled observations for a sample of the major parties to have held seats in parliament in the past two decades (1996–2016). The purpose is not to provide a systematic account of differences across the parties, or to evaluate the effect of changes in the party composition of the legislature on the aggregate patterns, but to simply document that such differences across parties exist.
Figure 2.2 illustrates the differences across a sample of parties in each country, with the countries arranged in order of maximum level of dynastic membership in a single party. In Germany, although Chancellor Angela Merkel is not herself a legacy MP, her CDU party and its Bavarian counterpart, the Christian Social Union (CSU), have had more legacy MPs in recent years than the Social Democratic Party (SPD), Die Linke (Link), the Greens (G), or the now-dissolved Party of Democratic Socialism (PDS). Many of the CDU and CSU legacy MPs are of noble background, including Carl-Eduard von Bismarck (CDU) noted earlier and Karl-Theodor zu Guttenberg (CSU).
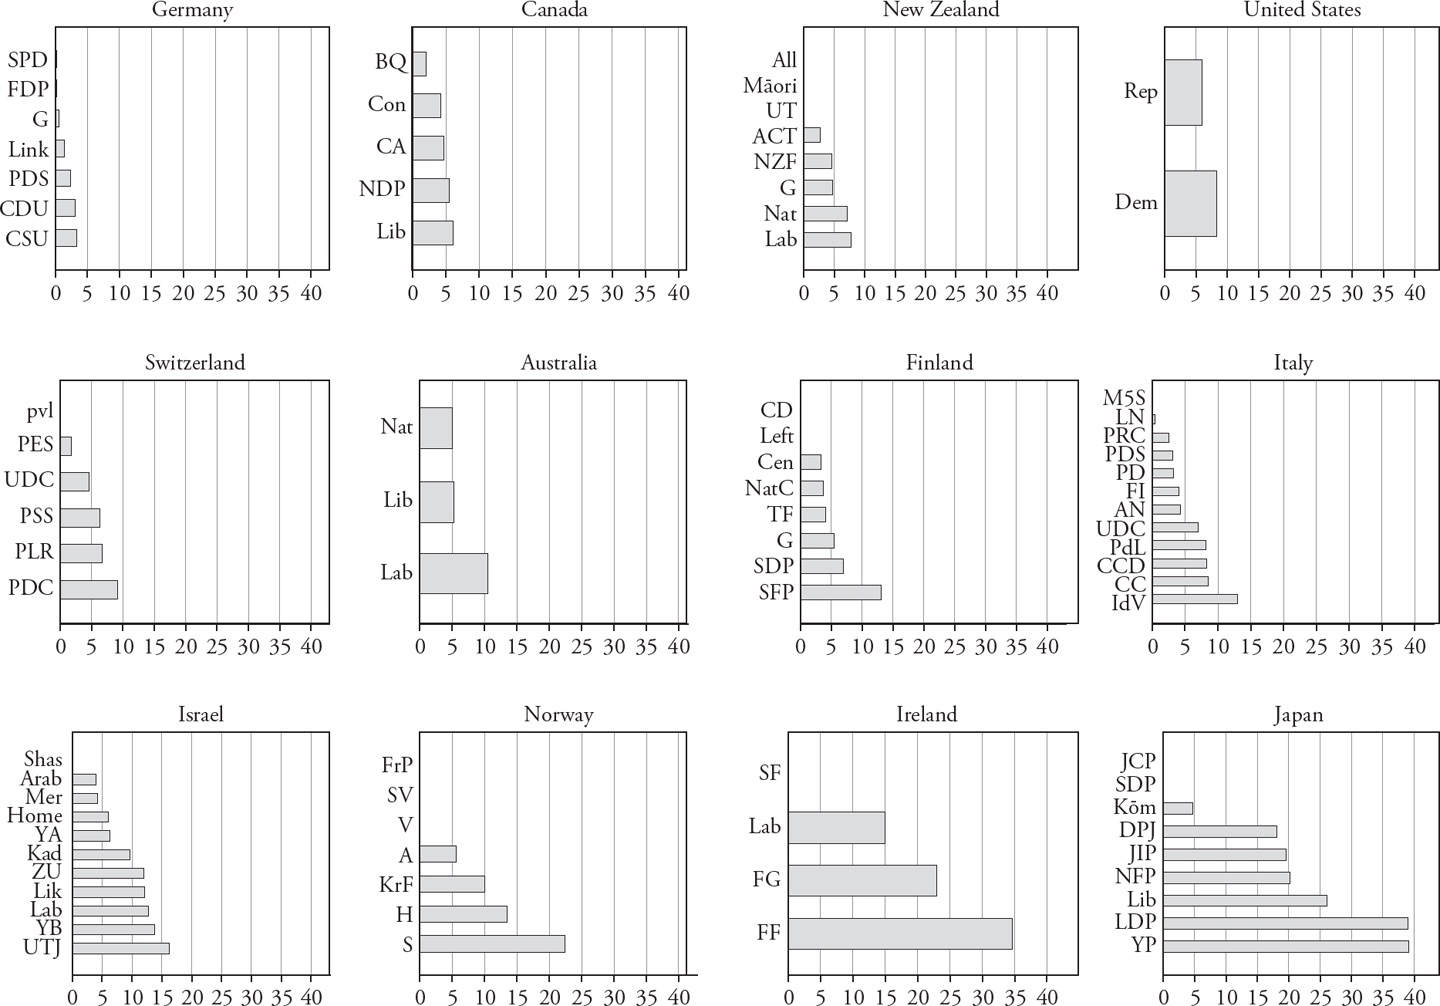
In Canada, legacy MPs have been least common in the Bloc Québécois (BQ) and most common in the Liberal Party (Lib), currently led by Prime Minister Justin Trudeau. Trudeau’s father, Pierre Trudeau, previously served as prime minister, and his maternal grandfather, James Sinclair, was an MP. In 2011, there was speculation that Mike Layton, a Toronto city councillor, might run in the by-election following the death of his father, New Democratic Party (NDP) leader Jack Layton, or that Layton’s widow, Olivia Chow (already an MP in the party), would seek the top leadership position, but neither ultimately pursued it.6 The short-lived conservative Reform Party of Canada, which became the Canadian Alliance (CA) in 2000, had just under 5 percent dynastic membership. It merged with the Progressive Conservatives to form the current Conservative Party (Con) in 2003 (Progressive Conservatives are grouped with Con in Figure 2.2). Although there have been fewer Conservative legacy MPs in recent years, at one point in 1962 the proportion exceeded 11 percent. The historical high for the Liberal Party was 13 percent, in 1958.
In New Zealand, the most dynastic party is Labour (Lab). Interestingly, although there have been no legacy MPs elected under the Māori party label, many of the legacy MPs in the Labour and National (Nat) parties—the two largest parties in New Zealand—are of Māori descent, including former cabinet ministers Nanaia Mahuta (Lab) and Tau Henare (Nat). The Green Party (G), ACT, and New Zealand First (NZF) have had fewer legacy MPs—5 percent or less—but this proportion represents a single individual in the former two parties (Kennedy Graham in the Greens and Roger Douglas in ACT), and just three individuals in NZF: Raymond Henare, Ria Bond, and Jim Peters, who is the brother of party leader Winston Peters. All are also of Māori descent. There were no legacy MPs in the Alliance (All) or United Future (UF).
The Democratic Party (Dem) in the United States has had more legacy members than the Republican Party (Rep) in recent years, although this has not always been the case. Up until the Reconstruction era, there were significantly more legacy members among Democrats, largely in the party’s stronghold in the South (Dal Bó, Dal Bó, and Snyder, 2009). However, Republicans were more likely to be dynastic from about 1916–1952. Since then, the proportion of legacy Democrats has been 7 percent, on average, compared to 6 percent for Republicans, with the two parties occasionally trading places as the most dynastic.
The four largest parties in Switzerland are the Liberals (Parti Libéral-Radical, PLR), the Swiss Socialist Party (Parti Socialiste Suisse, PSS), the Democratic Union of the Centre (L’Union Démocratique du Centre, UDC), and the Christian Democratic People’s Party of Switzerland (Parti Démocrate-Chrétien, PDC), which has had the largest proportion of legacy MPs since 1996. The former president of PSS, Hans-Jürg Fehr, is a legacy MP whose cousin Hermann Fehr served two terms in the 1980s and was mayor of the city of Biel in the canton of Bern. Fewer legacy MPs have served in the Green Party of Switzerland (Parti Écologiste Suisse, PES), which is relatively small by comparison, and no legacy MPs have been elected from the small Green Liberal Party (Parti vert’libéral, pvl).
In Australia, the Labor Party (Lab) appears to be the most likely to engage in dynastic candidate recruitment, with roughly 10 percent of recent MPs counting as members of a dynasty. One such legacy MP is Kim Beazley Jr., who was leader of the party from 1995 to 2001 and again from 2005 to 2006, and later served as ambassador to the United States. His father, Kim Beazley Sr., served for thirty-two years in the House of Representatives and as minister for education under Prime Minister Gough Whitlam in the 1970s. Beazley’s successor as Labor Party leader in 2001, Simon Crean, was also a legacy MP. His father, Frank Crean, served in the same Whitlam cabinet as the senior Beazley, and his brother David served in state-level office in Tasmania. Dynasties have been less common in recent years in the Liberal (Lib) and National (Nat) parties.
In four of the remaining countries in the comparative dataset, the aggregate proportion of legacy MPs has been lower than 10 percent but has exceeded 10 percent in some parties. In Finland, the Swedish People’s Party (Svenska Folkpartiet i Finland, SFP) appears to be the most dynastic, but this is in large part because it is a small party. The proportion (13 percent) is the effect of just two legacy MPs, Christina Gestrin and Nils-Anders Granvik, serving over this time period. The three largest parties are the Center Party (Cen), the National Coalition (NatC), and the Social Democratic Party (SDP). Among them, the SDP has had the most legacy MPs, including former minister of foreign affairs Erkki Tuomioja and former minister of finance Jutta Urpilainen. The Christian Democrats (CD) and Left Alliance (Left) have not had any legacy MPs in their membership in the past two decades, while there has been one legacy, Merikukka Forsius, elected from the Greens (G), and two, Anne Louhelainen and Ritva Elomaa, elected from the right-wing True Finns (TF). Because the Greens have had fewer members overall, the proportion is higher.
Italy’s fluid party system and joint lists also make cross-sectional comparisons of parties difficult. The Christian Democratic Centre (Centro Cristiano Democratico, CCD) and Union of the Centre (L’Unione dei Democratici Cristiani e di Centro, UDC) have had some legacy MPs, as have Italy of Values (Italia dei Valori, IdV) and Civic Choice (Scelta Civica, SC). Because these parties are not very large, the proportion reflects only three to four members. The large People of Freedoms (PdL) party associated with former prime minister Silvio Berlusconi had twenty-one legacy members after the 2008 election (7 percent). Several legacy MPs also hailed from Berlusconi’s Forza Italia (FI). Among recent party leaders and prime ministers, there have been a handful of legacy MPs, including former prime ministers Enrico Letta, Romano Prodi, and Massimo D’Alema, who were members of the Democratic Party (PD) and Democratic Party of the Left (Partito Democratico della Sinistra, PDS). The father of former prime minister Matteo Renzi had a career in local politics. Other Italian parties in Figure 2.2 are the National Alliance (AN), the Lega Nord (LN), the Communist Refoundation Party (PRC), and the Five Star Movement (M5S).7
Israel’s multiparty system is ever-shifting, which makes it especially challenging to track trends in dynastic politics within parties. From the time of Israel’s first elections in 1949 until 1977, the dominant part was the Labor Party (abbreviated as “Lab” in Figure 2.2, but known as Mapai until 1968), which has been led by legacy MP Isaac Herzog since 2013. On the right, the largest party since 1973 is Likud (Lik), founded by Menachem Begin in 1973. Although the current leader of Likud, Prime Minister Benjamin Netanyahu, is not a legacy MP, Menachem Begin’s son, Ze’ev Binyamin “Benny” Begin, is a member. United Torah Judaism (UTJ) only appears to be heavily dynastic because it is a very small party. A single legacy MP, Meir Porush, serving over the entire time period in the sample, accounts for the large proportion. Yitzak Levy is also singularly responsible for the proportion of legacies in the Jewish Home (Home), as is Yair Lapid in Yesh Atid (YA). There was also only one legacy MP elected through the Joint List of Arab parties (Arab): Haneen Zoabi. The other parties or electoral alliances included in Figure 2.2 are Yisrael Beiteinu (YB), Kadima (Kad), Shinui (Shin), Shas, Meretz (Mer), and Zionist Union (ZU). Of these, only Shas had no legacy members during the time period covered.
The most dynastic Norwegian party in recent years has been the Center Party (Senterpartiet, S). However, the Center Party is also a relatively small party, electing between ten and eleven members to the most recent parliaments, including two to three legacy MPs in each. The two largest parties, the Conservative Party (Høyre, H) and Labour Party (Arbeiderpartiet, A), have had between three and five legacy MPs in each parliament but tend to elect more members overall. The Liberals (Venstre, V), Socialist Left Party (Sosialistisk Venstreparti, SV), and Progress Party (Fremskrittspartiet, FrP) have not elected any legacy MPs to recent parliaments, whereas the small Christian Democratic Party (KrF) elected five individual legacy MPs to the Storting between 1996 and 2013.
Dynasties in Ireland have always been most common in Fianna Fáil (FF); however, the larger proportion in the pooled observations of recent Fianna Fáil MPs is in part the result of the party’s devastating loss in the 2011 election. Before the election, the party had seventy-seven MPs, twenty-eight of whom were legacies (36 percent). In the 2011 election, the party lost all but 20 seats, but nine of the survivors were legacies, resulting in a legacy proportion of 45 percent. Legacy MPs in Fine Gael (FG) have made up 20–25 percent of members across all recent elections (between eight and sixteen individuals). A few legacy MPs have also been elected from the Labour Party (Lab), but Sinn Féin (SF) has had none. Prominent legacy MPs in Ireland include recent prime ministers Enda Kenny and Brian Cowen, and a large number of cabinet ministers (Smith and Martin, 2017).
Japan’s partywise comparison again places it at the extreme end of dynasticism among the democracies in the comparative dataset, as legacy MPs in three parties—Ozawa Ichirō’s now-defunct Liberal Party (Lib), the LDP, and Your Party (YP)—made up more than 25 percent of total party membership between 1996 and 2016. At 39 percent each, the LDP and Your Party were the most dynastic parties out of all major parties during this time period in the twelve democracies of the comparative dataset. Your Party is a conservative breakaway party founded by an LDP defector, so it is not surprising that its level of dynastic politics would be similar to that of the LDP. The now-defunct New Frontier Party (NFP) was roughly 20 percent dynastic, a proportion similar to that in the conservative Japan Innovation Party (JIP, previously the Japan Restoration Party). The center-left DPJ has only been slightly less dynastic. Kōmeitō (Kōm) counted only two individual legacy MPs in its membership during this time period (Ikenobō Yasuko and Kitagawa Kazuo), but given the smaller size of the party, their presence meant that 5 percent of the party was dynastic. Not a single MP from the Social Democratic Party (SDP) or JCP came from a political dynasty during this time period, although there have been legacy MPs from both parties in the past (particularly in the SDP’s predecessor party, the JSP).
SUMMARY OF THE COMPARATIVE EMPIRICAL RECORDThe cross-temporal and cross-party variation in these twelve democracies serves to illustrate three important points that put Japan into comparative perspective. The first point is that Japan is not alone among democracies in terms of the continued presence of democratic dynasties. Dynastic politics are ubiquitous in some form or another across all democracies, and in different parts of the world. In other words, democratic dynasties are by no means a uniquely Japanese phenomenon.
A second point to note is that, even though democratic dynasties exist throughout the world, there is considerable variation in the level of dynastic politics across countries, parties, and time. The most common temporal pattern in the comparative cases is a decrease in dynasties over time, but different countries appear to have different ceilings and floors to the level of dynastic politics. Moreover, within countries, some parties are much more dynastic than others. In many country cases, the level of dynasticism within specific parties exceeds the overall level of dynasticism in the legislature. Thus, the aggregate proportion of legacy MPs in any given country and time may depend on the party composition of parliament. The cross-national and cross-party variation in dynastic politics is a puzzle that has received only limited attention in the existing literature on democratic dynasties.
The third and final point that merits attention is that, even though democratic dynasties are not unique to Japan, Japan is nevertheless among the most dynastic democracies, and its level of dynastic politics has grown over time, in stark contrast to the pattern in most other democracies. Moreover, Japan’s LDP has been the most dynastic major party across all of these democracies, in addition to being the most dynastic party in Japan (together with its smaller offshoot, Your Party). These facts are even more startling considering that Japan is an industrialized democracy with a large population and relatively low levels of inequality.
Japan’s Empirical Record
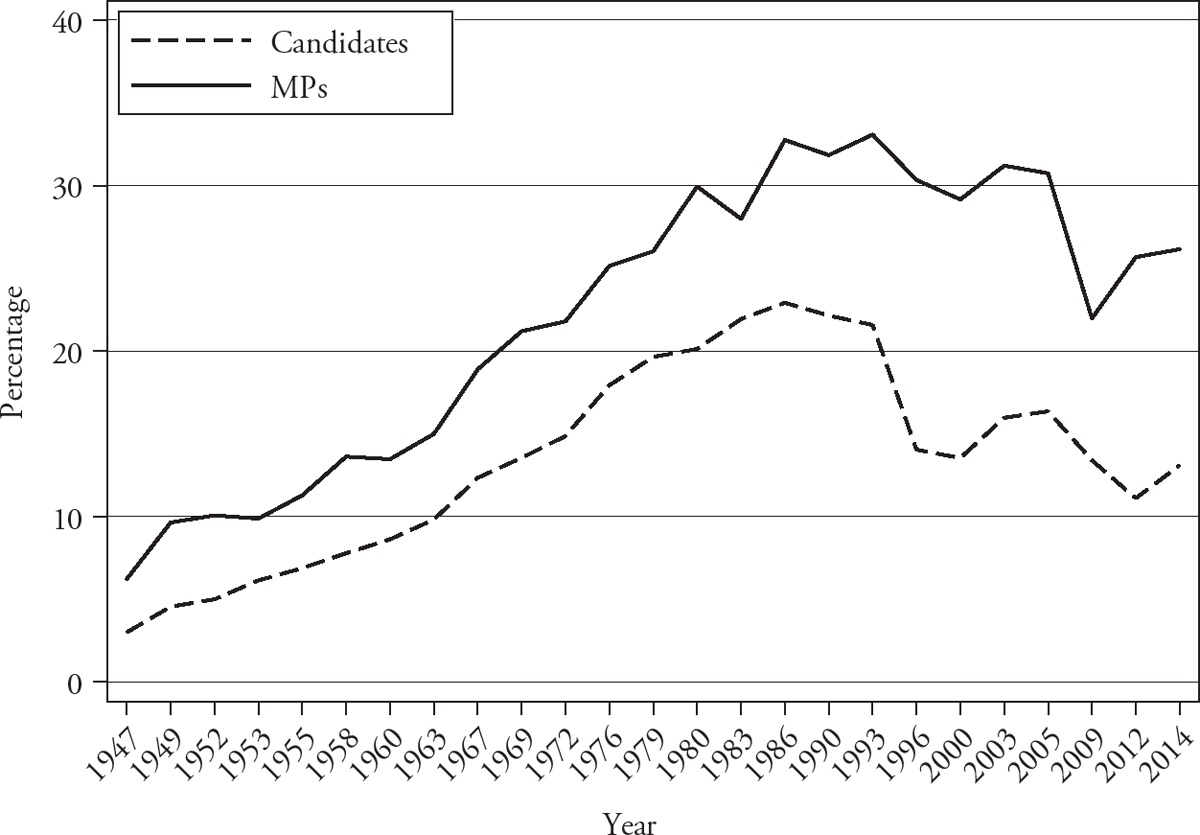
We have already seen how the percentage of legacy MPs among all MPs increased over time in Japan. However, it is also informative to compare this trend to the percentage of legacy candidates among all candidates over the same time period. This will give us a general sense of the electoral advantages that legacy candidates may enjoy, keeping in mind that differences in party, district, and other contextual factors play an obviously important role in determining which candidates are elected. Figure 2.3 shows that the percentage of legacies among all candidates in general elections (by-elections excluded) closely tracked the percentage among elected MPs until around the early 1990s, when the gap between the percentage of legacy candidates and percentage of legacy MPs began to widen.
Altogether, of the 10,060 individual candidates who ever ran in a House of Representatives general election or by-election between 1947 and 2014, 600 (6 percent) were legacy candidates. However, the total number of individuals includes many fringe candidates and candidates from minor parties who never had any chance at election. Only 3,065 of the individual candidates who attempted to get elected to the House of Representatives were ever successful in actually becoming an MP, and of these, 477 (16 percent) were legacies. In other words, nearly 80 percent of all legacy candidates in postwar Japan were successful at getting elected at least once. In comparison, just 27 percent of non-legacy candidates were ever elected to the House of Representatives.
We have also already seen that the LDP has had more legacy MPs in its membership in recent parliaments than most of the other parties. But overall, which parties recruited the greatest proportion of legacy candidates into running over the entire postwar period? The left-side panel in Figure 2.4 uses a mosaic plot to illustrate two pieces of information.8 First, the plot illustrates the distribution of candidates’ parties in JHRED for the entire time period, which gives us a sense of the prevalence of different parties overall in Japan. Second, the plot shows the distribution of legacy candidates within those parties. The x-axis at the top of the plot gives the fraction of candidate-level observations in the dataset for each major party, whereas the y-axis at the left of the plot indicates the fraction of legacy candidates within each party’s total observations.
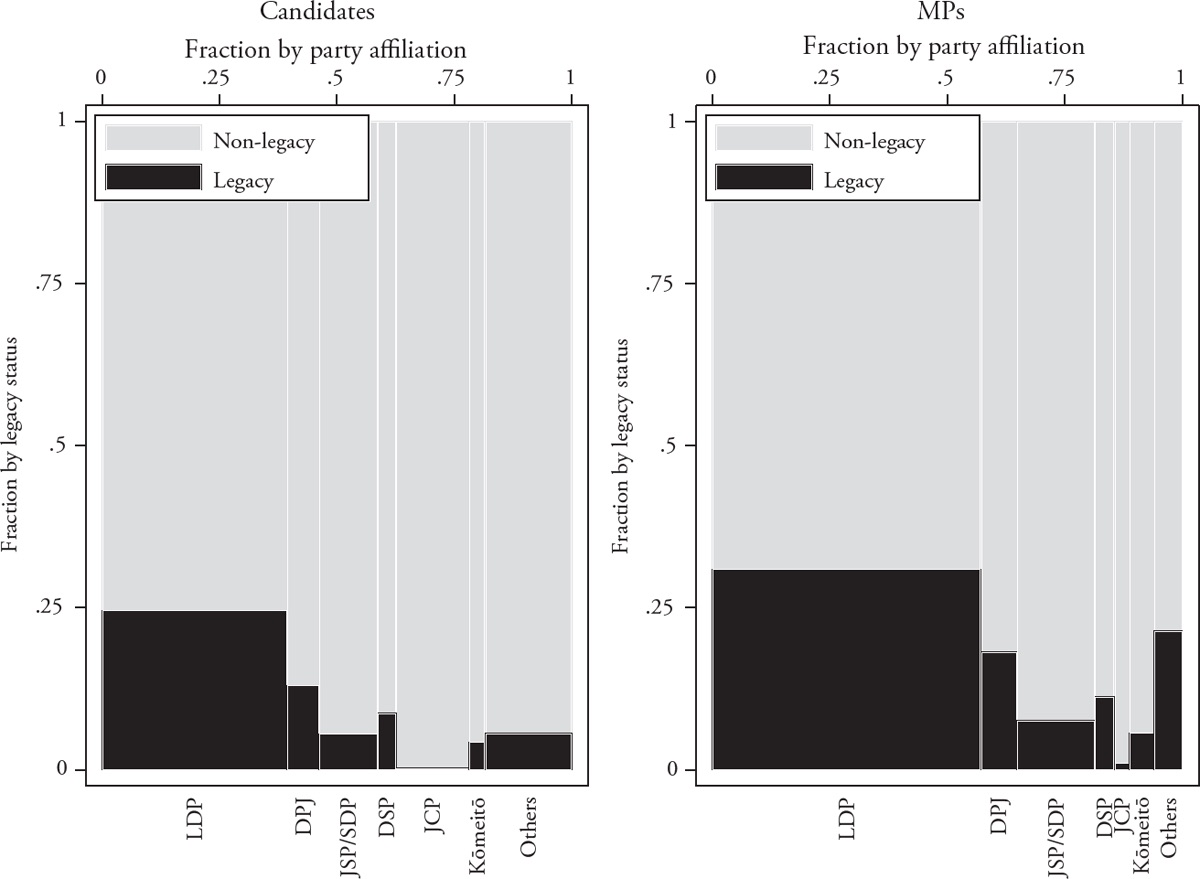
The actual JHRED party variable contains distinct identification codes for all parties, including separate codes to identify candidates who ran as independents but were in truth affiliated with a party and were either denied the official nomination or chose to eschew it for other reasons. To make the mosaic plot easier to visualize, party-affiliated independents are grouped with their respective parties. The LDP group includes the party’s precursors (i.e., conservative parties that fielded candidates from 1947 to 1955 and then merged to form the LDP). The JSP/SDP group includes the Leftist Socialists (1951–1955), and the DSP group includes the Rightist Socialists (1951–1955). Finally, nonaffiliated independents and candidates nominated by minor or short-lived parties are grouped into a single “Others” category.
The mosaic plot allows us to rule out straight away that the LDP’s high proportion of legacy candidates has anything to do mathematically with its size—as might explain the high proportions in some of the other small parties in the comparative cases we have seen. Almost 40 percent of all candidates in the dataset are affiliated with the LDP or its precursor parties. Within the LDP group, roughly a quarter of all candidates in the dataset are legacy candidates. The second largest party in terms of the fraction of affiliated candidates is the JCP (15 percent of all candidates), yet it has so few legacy candidates (just 12 observations; less than half a percent of all JCP candidacies) that the fraction is not even visible in the plot.
Among the small and ephemeral parties grouped together with independents as “Others,” the largest party is the fringe Happiness Realization Party (affiliated with the Happy Science religious movement), which fielded more than four hundred candidates between 2009 and 2014. Larger nonfringe parties in the “Others” group include the NFP, which was the second-largest party in 1996 (but disbanded shortly after), Renewal Party, Liberal Alliance, Ozawa’s Liberal Party, Your Party, Japan Restoration/Innovation Party, and Tomorrow Party of Japan (TPJ). Legacy candidates are most common in these larger, nonfringe parties, all of which were formed by defectors from the LDP—indeed, four of these parties (NFP, Renewal, Liberal, and TPJ) were all formed by legacy MP and perennial party creator (and destroyer) Ozawa Ichirō.
The right-side panel in Figure 2.4 shows the same type of mosaic plot for elected MPs. Here again, we can see the overwhelming size of the LDP—more than half of all seats between 1947 and 2014 went to candidates affiliated with either the LDP or its precursor parties. The fraction of legacy MPs within the LDP group (31 percent), as with all other party groups, is higher than in the full sample of candidates. This again hints at the electoral advantages that legacy candidates enjoy. Despite being the second largest party in terms of candidates, the JCP was far less successful at electing those candidates. However, among the JCP’s elected MPs, the fraction of legacy MPs (1 percent) is now just barely visible. Among the parties grouped into the “Others” category, the most dynastic is the New Liberal Club (NLC), which was a short-lived splinter party of LDP defectors led by several legacy MPs. Of the 49 seats held by the party between 1976 and 1986, 24 (49 percent) were held by legacy MPs.9 Most of the NLC members rejoined the LDP after 1986.
THE BEST BUTTER?In his reflections on what might set members of dynasties apart from other politicians in the United States, Stephen Hess (1966, p. 3) hypothesized that legacy politicians might represent the “best butter” in politics: “Old stock, Anglo-Saxon, Protestant, professional, Eastern seaboard, well to do.” These characteristics are obviously not all applicable to Japan, but other patterns may stand out. What are some of the background characteristics of legacy MPs in Japan, and do they differ noticeably from those of non-legacy MPs?
It may be useful to first look at the types of family relationships between legacy MPs and their predecessors. The top part of Table 2.1 gives the number and percentage of legacy candidates (one observation per individual) with different types of relationships to the elected politician who preceded their candidacy. Relationships are also split by the gender of the legacy candidate. For legacy candidates with more than one prior relative, the table gives only the most recent relative to have served prior to the legacy candidate’s first time running. For example, if an MP had two sons who served one after the other, the second son would be coded as following his brother into politics, not his father. The table also gives the same statistics for the sample of legacy candidates who were successful in getting elected at least once. The final column in the table gives the percentage of individual legacy candidates who were ever successful in getting elected (in other words, the ratio of MPs to candidates in each category).
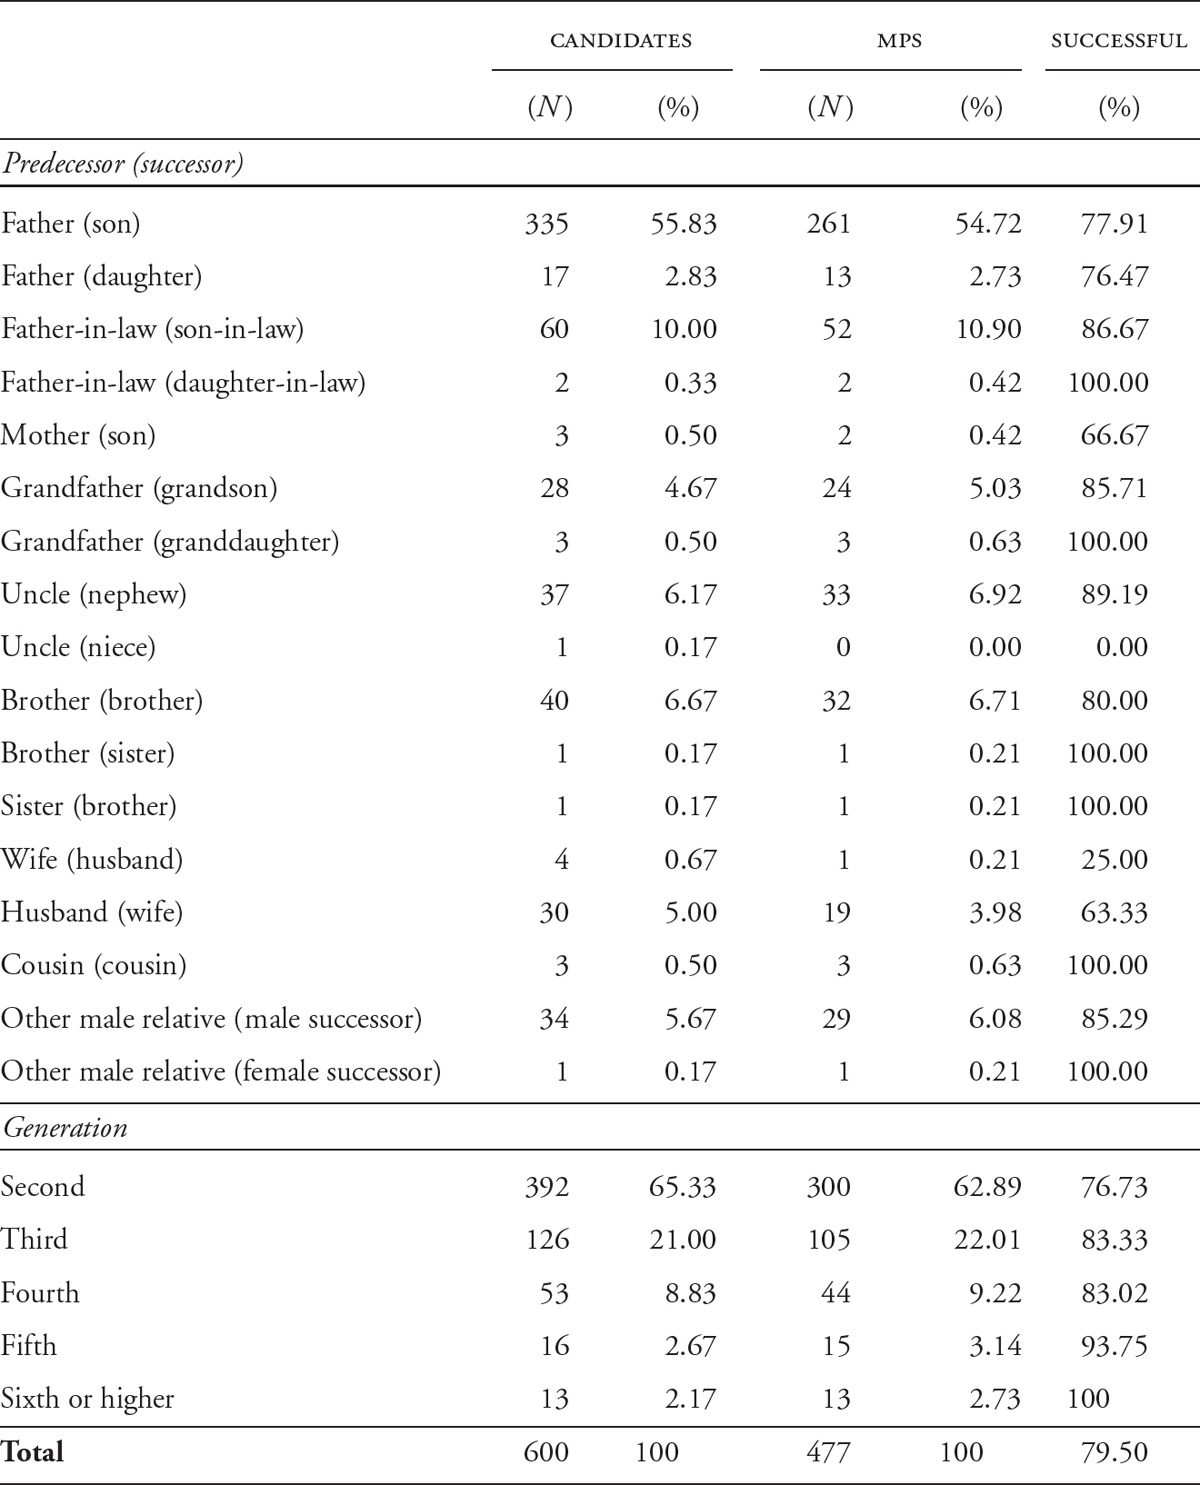
Not surprisingly, the most common family predecessor among all legacy candidates and MPs is a father. Nearly 59 percent of all legacy MPs followed in their father’s immediate footsteps. This is actually higher than in the United States and the United Kingdom, where approximately 30 percent of relationships within dynasties have been parent-child (Dal Bó, Dal Bó, and Snyder, 2009; van Coppenolle, 2017), but comparable to the pattern in Ireland, where 55 percent of predecessors have been fathers (Smith and Martin, 2017). Many of the candidates and MPs in the other relationship categories also had fathers who served before them but with a different family relative serving in between. The second most common type of predecessor is a father-in-law (including adoptive fathers), followed by other common male relatives: brothers, uncles, and grandfathers.
For wives of politicians, the path goes through widowhood in roughly half of the cases (fourteen of the candidates and ten of the MPs). There have been only four husbands who were preceded by their wives. One such husband, Tokano Takeshi, actually ran unsuccessfully as a candidate for the Tōhōkai party in the 1942 general election, but was purged by order of the General Headquarters (GHQ) of the US Occupation prior to the 1946 election. His wife, Tokano Satoko, ran in his place as a JSP candidate in 1946 and won. This makes her, not him, the “senior” member of the dynasty. Takeshi ran and lost again in 1949 and 1952 but ultimately was successful as a Rightist JSP candidate to the House of Councillors in 1953 (thus, he is not included in the MP count in Table 2.1). The one husband to be elected to the House of Representatives was Nishikawa Tomoo (NFP), who was elected in 1996 after his wife, Matsu Akira (legal name Nishikawa Reiko), had already been elected to the House of Councillors. The single case of a brother following a sister into office is Momiyama Akira (LDP), who directly succeeded his sister, Momiyama Hide. However, she herself had followed their adoptive father, Momiyama Hiroshi.
An interesting fact to note is that the success rate for legacy candidates who follow a father into politics tends to be lower than the success rates for legacy candidates who follow other common male relatives (fathers-in-law, grandfathers, uncles, and brothers). There are three possible, and not necessarily mutually exclusive, explanations for this difference. One is a regression to the mean in terms of the quality of politician’s children. In other words, the father may have been successful because he was exceptional, but the son (or daughter) was just average.10 In Japan, it is not uncommon to adopt a son-in-law as heir to a family estate or business, especially when the head of the family or founder of the firm lacks a biological male heir. The adopted son then takes the name of the family and continues the patrilineal line. There is even an adage in Japan that relates this practice to quality: “You cannot choose your sons, but you can choose your sons-in-law.” Research on family-run firms in Japan has found that businesses inherited by sons-in-law tend to perform better than those inherited by biological heirs (Mehrotra et al., 2013). Similarly, sons-in-law and more distant male relatives may be, on average, of higher political quality than sons.
A second possible explanation is a difference in selection bias for the recruitment of non-consanguineous or distant relatives. No legacy candidacies are randomly assigned. But following a father into politics may seem to be an obvious or “natural” career choice for many political children, just as occupational inheritance from father to child is common among doctors, lawyers, and other professions. As a result, some children of male politicians may wish to follow in their fathers’ footsteps even if he was not particularly popular or successful. In contrast, it could be the case that following a more distant male relative into politics involves more of a calculated decision to select into politics. The male predecessors in such cases may have been more popular, or party actors involved in candidate selection may have had greater reason to recruit a relative as a successor even if there was no son available to nominate. The electoral success of the successors, then, might have more to do with the quality of the predecessors than with the quality of the successors.11 The third possible explanation is that sons, for whatever reason, may face stiffer competition from other challengers when they attempt to succeed their fathers. If sons also tend to be of lower quality, on average, then they are easier for those challengers to defeat.
The bottom part of Table 2.1 gives the number of generations of politicians within the family for legacy candidates and MPs. For unelected candidates, this is the number of members who would have served from the family if they had been elected. However, if a legacy candidate failed to be elected, the family would not count as having successfully created a democratic dynasty. For those who were ultimately successful, however, the number represents the number of members of the MP’s dynasty (including the MP) to have served in the Diet.12 About 65 percent of all legacy candidates only had one previous family member serve in national politics before they ran, and 77 percent of these second-generation legacy candidates were successful in getting elected—thus creating a democratic dynasty. The success rate grows with each successive generation in a dynasty. In other words, members of older political dynasties—that is, those with a larger number of previous members—tend to get elected if and when they run. All of the legacy candidates with six or more predecessors were successfully elected to the House of Representatives, which is not surprising if one considers that the incentives for perpetuating a dynasty likely depend on the past success of members of that dynasty. Roughly 83 percent of legacy candidates, and 82 percent of legacy MPs, shared the same family name as their nearest predecessor.
Is there a Japanese equivalent to the American Eastern Seaboard? In other words, have some of Japan’s prefectures or regions been more dynastic than others? Although the Eastern Seaboard may have been a common regional setting for some of the most prominent dynasties in the United States, the most dynastic US region historically has actually been the South. For the case of India, in contrast, Kanchan Chandra (2016, pp. 18–20) finds that dynasties are relatively evenly dispersed across districts and regions. Figure 2.5 shows a map of Japan’s forty-seven prefectures, shaded to indicate the percentage (range) of legacy MPs among all MPs elected from each prefecture from 1947 to 2014. Because district boundaries change over time, the data are aggregated to the level of prefecture. In addition, MPs elected to the PR tier in the postreform period (in which districts are regions comprising multiple prefectures in most cases) are excluded. Lighter (darker) shaded prefectures indicate a lower (higher) percentage of all seats in the House of Representatives that were held by legacy MPs.
If there is a Japanese equivalent to the American Eastern Seaboard, it is actually the country’s western seaboard. The two most dynastic prefectures are neighboring prefectures in the Chugoku region of western Japan: Yamaguchi (47 percent), which is home to Prime Minister Abe Shinzō (Yamaguchi 4th District), and Shimane (53 percent), home to former prime minister Takeshita Noboru. The Abe dynasty accounts for the large share of the dynasties in Yamaguchi. Abe is a sixth-generation legacy MP. He succeeded his father, Abe Shintarō, whose father-in-law, former prime minister Kishi Nobusuke, also came from Yamaguchi. In addition, Abe Shintarō’s father (Shinzō’s paternal grandfather), Abe Kan, served prior to 1947. Kishi’s brother, former prime minister Satō Eisaku, served from Yamaguchi, as did his son Satō Shinji. Finally, Abe Shinzō’s younger brother Kishi Nobuo has been an MP for Yamaguchi 2nd District since 2012. No other prefecture has been so consistently dominated by one family.
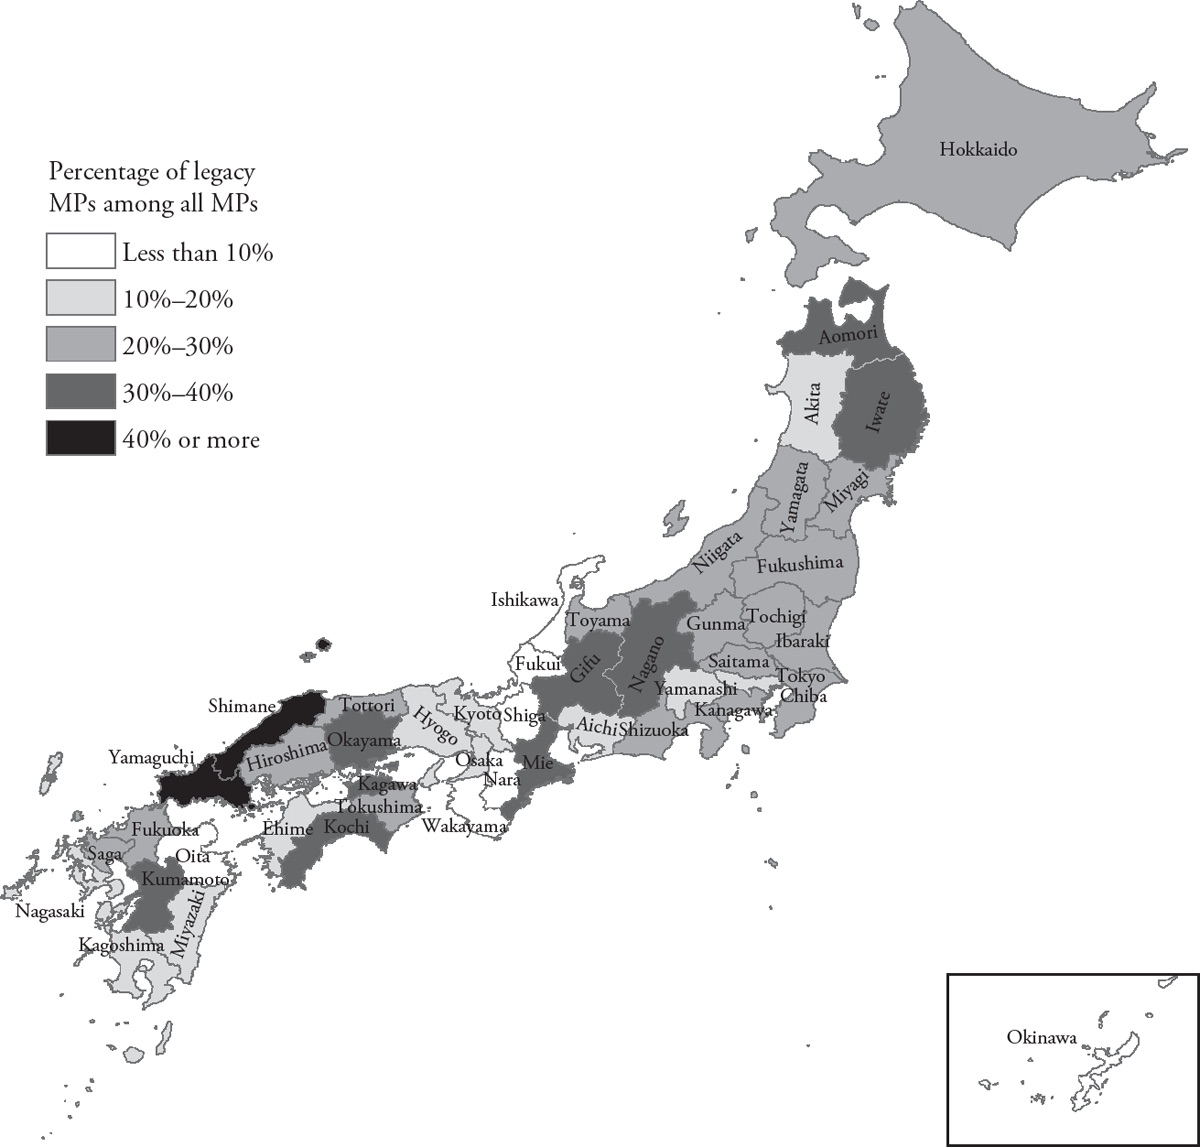
The high proportion of dynasties in Shimane may in part be because it is a relatively small prefecture in terms of population and parliamentary seats, with only a single five-seat district from 1947 to 1993, and just two single-seat districts from 1996 to 2014. For much of the prereform period, competition in the LDP revolved around Takeshita, Sakurauchi Yoshio, and Hosoda Kichizō. In postreform Shimane 1st District, Hosoda’s son, Hosoda Hiroyuki, has consistently held the seat (he was first elected in 1990). Since 2000, the seat in Shimane 2nd District has been held by Takeshita’s brother, Takeshita Wataru (Noboru himself won the seat in 1996).
The least dynastic prefecture is Shiga, where less than 1 percent of all elected MPs since 1947 have been legacy MPs. Shiga is also a relatively small prefecture—like Shimane, it returned just five MPs in a single prefecture-wide district from 1947 to 1993. Since electoral reform, it has had four single-seat districts. One of Shiga’s longtime MPs was Uno Sōsuke, who served as prime minister for just two months in 1989 before resigning amid a sex scandal involving a geisha.13 His son-in-law Uno Osamu later won a seat in the PR tier (so does not contribute to the percentage indicated in the map). The only legacy MP to ever hold a non-PR seat in Shiga Prefecture is Konishi Osamu in Shiga 2nd District, who was elected in a by-election in 2001. He lost his race in the general election in 2003 but was elected to the PR tier.
Six other prefectures—Okinawa, Wakayama, Fukui, Oita, Nara, and Ishikawa—have been represented by legacy MPs less than 10 percent of the time. All other prefectures fall in the range of 10–40 percent dynastic. There are no clear patterns in the geographic distribution of dynasties unless one reads into the white-shaded belt running from Ishikawa on the western coast to Wakayama on the Pacific coast. However, the small percentage of dynasties in each of these prefectures likely has more to do with the smaller number of seats in each, and the occupation of these seats for many decades by first-generation MPs. For example, it was widely expected that former prime minister Mori Yoshirō of Ishikawa Prefecture—who served fourteen terms from 1969 to 2012—would be succeeded by his son, Yūki, who was a local prefectural assembly member. However, Yūki died suddenly in 2011. Okinawa may have fewer legacy MPs in its record simply because it has only been a prefecture since 1972, when the United States returned sovereignty over the islands to Japan.
Gender and age are also relevant demographic background characteristics to consider. Previous studies in diverse contexts have noted that women have often entered politics on the heels of a close male relative (e.g., Jalalzai, 2013; Basu, 2016; Folke, Rickne, and Smith, 2017), often in the form of a so-called widow’s succession. Japan is not different from other democracies in this regard. While women have made up just over 5 percent of all non-legacy MPs, they account for 8 percent of all legacy MPs (Table 2.2). Or considering the relationship from a different angle, legacy MPs represent roughly 22 percent of all female MPs but just 15 percent of all male MPs. Chapter 7 explores the relationship between gender and dynastic recruitment in more detail, but these patterns indicate that one characteristic that sets legacy MPs apart from other MPs is that they are significantly more likely to be women. In addition to the gender difference, legacy MPs in Japan also tend to get elected at a younger age than non-legacy MPs. The median age for first-term legacy MPs in the House of Representatives is forty-two years old, compared to forty-eight for non-legacy MPs. Legacy MPs in the United States and Ireland have similarly been shown to enter politics at a younger age (Dal Bó, Dal Bó, and Snyder, 2009; Smith and Martin, 2017).
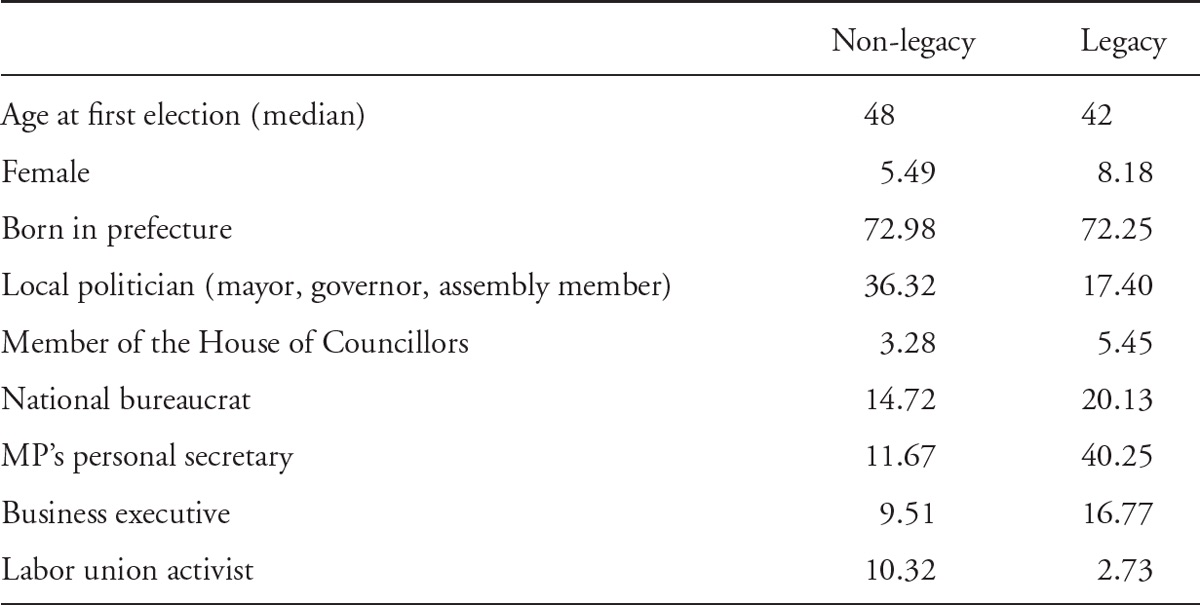
The difference in age at entry suggests that legacy MPs might be able to bypass some of the traditional pathways to a career in national politics, such as first gaining experience in local politics (e.g., municipal or prefectural assembly member, municipal mayor, or prefectural governor). Prior local political experience is often viewed as an important stepping-stone to national office and a key measure of candidate quality (Jacobson, 1989). In bicameral systems, serving in the other chamber (i.e., the House of Councillors in Japan) is also an obvious indicator of experience. In addition to these traditional ways to gain political experience, candidates in Japan often gain experience and connections through careers in the national bureaucracy or by serving as a personal secretary to an incumbent MP (Scheiner, 2006). Table 2.2 shows the percentage of non-legacy MPs and legacy MPs who had a background in each of these common pathways into politics. Legacy MPs are indeed significantly less likely to have progressed through local politics on their way to national office than non-legacy MPs. This is again consistent with previous findings in the United States and Ireland, as well as in India (Bohlken, 2016). In contrast, legacy MPs in Japan more often gain political experience through serving as a personal secretary to an incumbent MP (most often their relative). Prior experience in the House of Councillors or the national bureaucracy is also slightly more common among legacy MPs, but this is because these pathways are more common in the LDP. The difference between non-legacy and legacy MPs for these two pathways is not significant if only LDP and LDP-affiliated MPs are compared.
Recall that sons-in-law tend to perform better in elections than biological sons. It is difficult to determine whether this is because they are of higher quality, given the challenges in accurately measuring the quality of individuals. However, if political experience can be considered an indication of quality, then sons-in-law are slightly more likely than sons to have experience in prior elective office in local politics or the House of Councillors (25 percent compared to 20 percent), and much more likely to have had a career in the national bureaucracy (58 percent compared to 11 percent). This makes sense given that bureaucrats are an obvious set of eligible bachelors who might come into contact with politicians and their daughters. Sons-in-law are less likely to have served as a politician’s personal secretary (27 percent compared to 51 percent).
Information on place of birth is only available for 2,109 of the 3,065 individual MPs in JHRED, but for this sample there is no significant difference between non-legacy and legacy MPs in terms of whether they were first elected in the prefecture of their birth (roughly three-quarters of MPs regardless of legacy status). In other words, legacy MPs are no more likely to be “local” than non-legacy MPs. Among the other occupational backgrounds coded in JHRED (law, medicine, education, agriculture, business, news media, labor union, and religion), only business and labor union backgrounds are significantly different across non-legacy and legacy MPs. A business background includes major experience as a company executive (such as president or director, not simply employee). About 17 percent of legacy MPs had some such experience, compared to less than 10 percent of non-legacy MPs, and the difference is significant even if the sample is restricted to the LDP, which has historically had stronger ties to business interests. It is impossible to say whether dynastic succession in politics for these MPs might be encouraged by patterns of dynastic succession in business leadership. The difference between non-legacy and legacy MPs in terms of labor union background is entirely driven by party differences. About 10 percent of non-legacy MPs had a background in the labor movement, compared to just 3 percent of legacy MPs. However, a labor union background is common only among MPs from the JSP, DSP, and JCP. The difference between non-legacy and legacy MPs is not significant when comparing within these parties.
Finally, it is worth investigating whether legacy MPs tend to have higher levels of education or wealth than non-legacy MPs. Such human capital resources might help explain why legacy candidates do better in elections than non-legacy candidates, although existing research has reported inconsistent patterns. Benny Geys (2017), for example, finds that legacies in local Italian politics tend to have lower levels of education than their non-legacy peers. In contrast, legacy MPs in India tend to be slightly more educated than their non-legacy peers (Bohlken, 2016), and most legacy MPs in Ireland do not have significantly higher or lower levels of education (Smith and Martin, 2017).14 Unfortunately, JHRED does not contain complete information on the educational backgrounds of all MPs from 1947 to 2014. However, we can get a sense of whether there are any differences by looking at the group of MPs elected in 2014, for which complete information is available.15
Figure 2.6 again uses mosaic plots to show the distribution of level of education and place of education by legacy status for the 475 MPs elected in 2014. For level of education, displayed in the left panel, the “postgraduate degree” category includes any degree (master’s or doctorate) above a bachelor’s degree. “Some university” includes university dropouts and graduates of junior colleges. For place of education, displayed in the right panel, MPs are grouped according to the place where they earned a junior college or bachelor’s degree (or “secondary school” if they did not attend university or dropped out). Universities and colleges are grouped into three categories: the prestigious University of Tokyo (the country’s top public university), “private university” (including all private universities, as well as foreign universities), and “other public university” (all other local public universities in Japan).
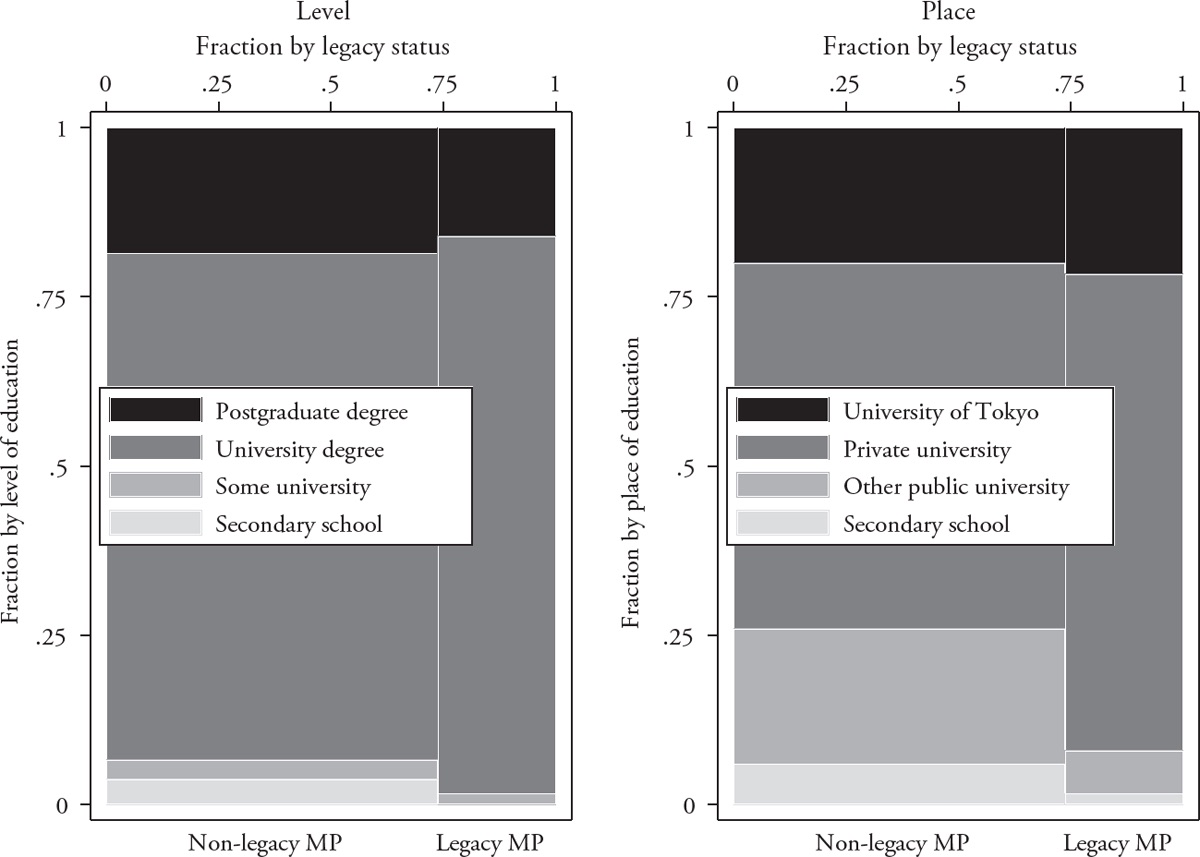
A bachelor’s degree from the University of Tokyo, which has very competitive and merit-based admissions, might be viewed as an indication of an MP’s quality of intellect or knowledge. While many private universities are prestigious, a degree from one may also be viewed as a measure of wealth (although tuition is still lower than private universities in the United States). Other public universities, apart from Kyoto University, are generally considered less prestigious than the University of Tokyo. The mosaic plots indicate that although there is not much of a difference between non-legacy and legacy MPs in terms of having earned a postgraduate degree, legacy MPs (about a quarter of all MPs in 2014) are more likely to have earned at least a university degree (left panel). In contrast, the fraction of MPs who attended a private university for their undergraduate degree is much higher among legacy MPs than non-legacy MPs (right panel). This may be an indication of greater wealth in the families of legacy MPs.
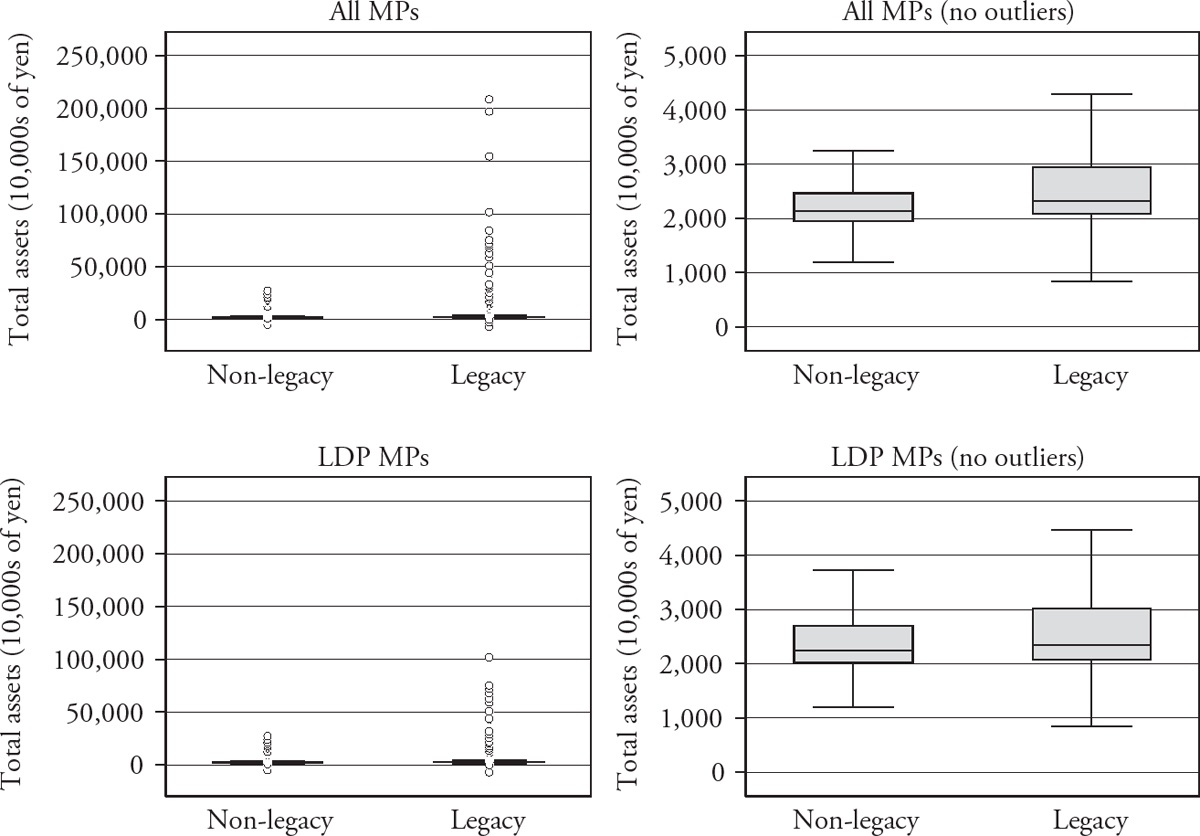
The wealth of non-legacy MPs and legacy MPs can be directly compared by using public declarations of income and assets (shotoku-shisan kōkai). These yearly reports have been published in the Asahi Shimbun newspaper since 1993. The box-and-whisker plots in Figure 2.7 show the distribution of MPs’ declared wealth for all non-legacy and legacy MPs (top panels), and for just the members of the LDP (bottom panels), from 1993 to 2014. Each MP’s total worth can vary from year to year, depending on sales of assets, capital gains and losses, and so on, so the observations have been pooled across all twenty-two years of available data.
If we compare the total assets of non-legacy MPs and legacy MPs (left panels), legacy MPs are by far richer. However, this sample includes several outliers of extremely rich legacy MPs like Sasagawa Takashi—son of Sasakawa Ryōichi, the Class-A accused war criminal who went on to make a fortune in motorboat racing and later founded the Nippon Foundation—whose total assets were as high as ¥2 billion in 2000. Other extremely wealthy legacy MPs include Nakamura Shōzaburō, president of Nittō Kōtsū bus transportation company, and Asō Tarō, whose family owns a mining company. If we exclude these outliers (right panels), the wealth difference between non-legacy and legacy MPs is largely erased, and it is revealed that some legacy MPs have among the lowest wealth. The median declared yearly assets of non-legacy MPs in the LDP is ¥22,410,000, just slightly lower than the ¥23,470,000 of their legacy peers.
The overall empirical record from Japan suggests a number of general patterns. First, the proportion of legacy MPs exceeds the proportion of legacy candidates, both in the aggregate and in specific parties, which suggests that legacy candidates in Japan do indeed enjoy an electoral advantage. The difference between the percentage of legacy candidates and the percentage of legacy MPs cannot simply be attributed to the fact that most legacy candidates are fielded by the LDP and that LDP candidates, in general, tend to enjoy an electoral advantage. Second, the electoral advantage appears to increase with each successive generation within a dynasty. This may indicate a selection effect at the heart of predicting which dynasties will persist beyond a handful of generations. The more generations in a dynasty, the more indication that voters have responded well to members of that dynasty in the past, and the better the response of voters, the more likely a dynasty will continue for another generation.
The overall empirical record does not indicate an obvious geographic pattern to dynastic politics in Japan, much like in the Indian experience. Yamaguchi and Shimane prefectures happen to have had more legacy MPs than other prefectures, but the reasons behind this pattern appear to be largely idiosyncratic. However, it is important to keep in mind that the aggregate prefectural-level patterns presented in this chapter may overlook district-level differences within prefectures, as well as changes over time.
It also appears unlikely that the electoral advantage enjoyed by legacy candidates can be explained by differences in their personal characteristics. Legacy candidates are more likely to be women, and women do not normally do well in Japanese elections. Legacy candidates are also more likely to be younger than non-legacy candidates and less likely to have had previous political experience in elective office at the local level. These patterns suggest that the inherited incumbency advantage enjoyed by legacy candidates may help them to overcome obstacles that might prevent other young, inexperienced, or female candidates from getting selected and elected. However, it does not appear to be the case that the inherited incumbency advantage operates through greater access to education or wealth. Legacy candidates are not considerably more likely to have a degree from the prestigious University of Tokyo or to have a postgraduate degree. They do appear to be more likely to attend private universities than public universities, but apart from a handful of extremely wealthy families, legacy candidates are not uniformly wealthier than their non-legacy counterparts.
These patterns in the characteristics of legacy candidates and MPs in Japan largely correspond to patterns in other countries where comparative data have been explored. As in the United States, India, Ireland, and elsewhere, legacy MPs tend to be younger, less experienced in terms of previous public service in local office, and more likely to be women. However, the average legacy MP is not significantly more educated, nor does he or she possess more wealth, two attributes related to human capital that might be hypothesized as forming part of the inherited incumbency advantage. We must look beyond the “best butter” argument to explain the pattern of dynastic politics in Japan.
History or Culture?
The argument advanced in this book is that institutions, namely the electoral system and candidate selection process in the LDP, helped to foster the emergence and rampant spread of dynastic politics in Japan. However, an alternative explanation is that Japanese politicians—or Japanese people more generally—are historically or culturally predisposed to dynastic politics. After all, Japan had a long history of feudalism and a highly hierarchical social system. Could Japan’s postwar experience with dynastic politics simply be a cultural legacy of its past? The party-level differences in all the comparative cases presented thus far already undermine the credibility of such historical or cultural explanations—after all, presumably politicians across different parties in the same country share a common history and culture. Nevertheless, it is useful to briefly explore and definitively rule out this alternative explanation for the case of Japan before proceeding to the main theoretical argument in the next chapter.
Japan has indeed had a long history of hereditary succession in politics, as well as in other occupations. Hereditary rule under the Yamato clan was established in much of Japan by AD 500 and formalized as an imperial system by the mid-600s (Totman, 1981, pp. 21–25). This early imperial rule descended into chaos in the twelfth century, with hereditary military dictators (shōgun) warring over the archipelago, until the Tokugawa clan finally solidified control in 1600. Under Tokugawa rule from 1600 to 1868, Japanese society was highly stratified, and hereditary roles were maintained and enforced through strict rules. The feudal lords (daimyō) were at the top of this hierarchy, followed by the samurai warrior class, who eventually began to take on more of a bureaucratic role in the state. Farmers, artisans, and merchants ranked below, and each man’s status was fixed by inheritance. Some class mobility was possible in the later years of the Tokugawa period through marriages of mutual convenience between merchant and farming families whose wealth was increasing, and lower ranking samurai families who were on the decline (Isoda, 1998). However, male children were generally expected to inherit the same class and occupation of their fathers.16
Following the Meiji Restoration in 1868, the Tokugawa caste system was abolished, and greater political participation was allowed. In the 1870s, the government allowed all non-samurai to take on surnames and granted the freedom to intermarry between classes, purchase land, and choose one’s own profession. The samurai’s stipend was abolished in 1876, effectively eliminating the samurai as a class and ushering in greater political opportunities for rural elites, wealthy businessmen, and landlords, many of whom became active in the Popular Rights Movement in the late 1800s to establish a constitution and an elective assembly (Pratt, 1999, pp. 32–40). Such an assembly, the National Diet, was ultimately established in 1890. The upper chamber, the House of Peers, was modeled after the British House of Lords and restricted to hereditary peers from noble families (kazoku) and appointees chosen by the emperor with consultation from the Privy Council.17 Princes of the blood (who were related to the imperial family but were not in the direct line of succession) were entitled to sit by hereditary right, but they did not exercise this right, nor did they contest elections for the lower chamber, the House of Representatives, which was designed to be closer to the people, like the British House of Commons. Nevertheless, participation in House of Representatives elections was initially open only to wealthy male citizens who could meet the high tax requirement for voting rights and eligibility for public office. In the first Diet election in 1890, about one-third of those who were elected came from the former samurai class (Mason, 1969). The rest were local notables who were both “locally secure and securely local” (Gluck, 1985, p. 69).18
The electoral system for the House of Representatives changed multiple times as a consequence of compromises between the oligarchs who controlled the House of Peers and the Privy Council, and party politicians active in the House of Representatives, all of whom had their own preferences. The first electoral law employed a plurality system in small districts, with district magnitude being only one or two seats, with one or two votes given to voters. This system was opposed by oligarchs such as Yamagata Aritomo, who feared the development of strong parties, as well as party advocates like Itō Hirobumi, who disliked the cost and localism of the small district system, and believed (perhaps erroneously) that larger-sized districts would shift the focus to candidates with a more national base, would lower costs, and would strengthen the foundations of parties (Ramseyer and Rosenbluth, 1995; Kawato, 2002). Thus, the electoral system was changed in 1900 to feature larger districts (M greater than six) and the SNTV voting method. The “large-sized” district system was again replaced with a small-sized district system in 1919, with M ranging from one to three seats, but SNTV was retained. Finally, in 1925, universal male suffrage was adopted, and the electoral system again changed to a “medium-sized” (M ranging from three to five) system that would be used for the remainder of the prewar period and again after 1947.
Despite the expansion in suffrage, candidates with local prestige or connections continued to be heavily favored in candidate selection and elections, as did candidates from the former samurai class. Partly, this was due to the imposition in 1925 of a steep election deposit system, with the requirement that a candidate overcome a threshold of one-tenth of the total vote in the district divided by district magnitude to have the deposit reimbursed. The deposit amount was set at a steep ¥2,000, which would have been roughly $1,000 at the time, or roughly $15,800 if adjusted to today’s prices (Harada and Smith, 2014). Naturally, this meant that only wealthy or well-supported candidates could afford to run. Harold Quigley (1932, pp. 264–265) notes that candidates from powerful local families were the most successful at getting elected during the prewar years of so-called Taishō Democracy:
Personal prestige appears to be the essential quality in a candidate. A connection to a formerly powerful clan, relationship to a locally respected family, reputation for cleverness as a journalist or speaker—these attributes are highly regarded by the voters. Party platforms are too indefinite and the speeches of politicians too vague to afford even the well-educated voter a hold on reality. The respect felt for officials contributes to the success of candidates who hold, or have held, prefectural or municipal offices.
In these respects, the historical evolution of dynastic politics in Japan does not differ dramatically from that of many developing democracies or Western European democracies, where political rights were gradually increased through democratic reforms that lessened the influence of the previous aristocratic elite. In many European countries, the introduction of parliamentary democracy at first failed to undermine the power of the noble classes, who came to occupy powerful positions in both elective office and the military. For example, in the late 1890s to early 1900s, the share of elected politicians who were descendants of the aristocratic noble classes remained as high as 20 percent in the United Kingdom, Germany, Italy, and the Netherlands. However, by the end of World War II, only in the United Kingdom did members of the nobility comprise more than 5 percent (but less than 10 percent) of MPs (Rush, 2000, p. 30). Similarly, we have seen how (nonaristocratic) political dynasties have declined over time in most other countries following democratization. However, Japan’s democratic reforms in the Taishō and post–World War II periods, while easing restrictions on political participation, actually preceded the dramatic rise in dynasties. Few legacy MPs in the postwar period come from prewar aristocratic families; most come from dynasties that were newly created after full democratization in 1946 (Ichikawa, 1990).
It may also be tempting to ascribe Japan’s seeming predisposition to dynastic politics to a cultural norm of filial piety and intergenerational occupational succession that has continued since the Tokugawa times. For example, anthropologist Ruth Benedict (1946, pp. 72–73) argues that, unlike developments in Europe following industrialization and modernization, Japanese tendencies toward feudalism and hierarchy were retained in society, partly because of mechanisms for social mobility that undercut motivations for an even playing field. Indeed, many scholars of postwar Japanese politics and society have commented on the continuing hierarchical nature of social groups, modeled after a traditional family system. Some have also argued that this vertical hierarchy helps to explain patterns of succession in both business and politics (e.g., Ike, 1957; Yoshino, 1968; Nakane, 1970). When a leader retires, he is expected to designate a successor who is suitable to his group or subordinates. Oftentimes, this is a son (usually the firstborn) or, as noted, an adopted son-in-law. Other times, it is a nonrelated successor, such as a personal secretary or close associate. Dynastic succession persists in this form in many businesses—from fish-market stalls (Bestor, 2004) to publicly traded firms (Saito, 2008). This type of “successor designation” was also clearly evident in the patterns of jiban transfer during Japan’s SNTV period. Conservative candidates and voters who support the LDP might be especially predisposed to preserving these traditional views of family and obligation.
Historical or cultural explanations are thus common in popular references to dynasties in Japan. For example, a 2008 Los Angeles Times newspaper article about Japan’s political dynasties quoted a university professor of public management who hypothesized that “the reliance on family succession is historical, a sort of underground current that still flows through Japan, whether in business or in politics. The old ways are changing in business because globalization is forcing companies to compete abroad and make profits. But politics is strictly domestic. In politics, there is no pressure to change.”19
On the contrary, subsequent chapters of this book demonstrate that dynastic politics in Japan have evolved considerably since institutional reform in the 1990s, which provided the needed pressure to change. The 1994 electoral reform placed greater emphasis on parties and their national platforms. Parties have responded in kind by recruiting fewer candidates from traditional local channels, including legacy candidates, and more candidates who suit their national image or policy goals, such as women, popular celebrities, and policy experts.
If dynastic politics were simply a result of unique aspects of Japan’s history or culture, we would not expect to observe much variation across Japanese parties. Yet the data presented in this chapter illustrate that there are considerable differences across parties when it comes to dynastic politics. Since culture and historical patterns are often resilient, we would also not expect to observe much change following institutional reforms to electoral rules or candidate recruitment. Even if dynastic politics were more closely tied to the conservative values of the LDP, we should not expect these values to change dramatically simply because of institutional reform. Yet the nature of dynastic politics in Japan has changed considerably since the 1994 electoral reform, even as elements of path dependence have conditioned the effects of this institutional change.
Additional evidence against a historical or cultural argument for dynastic politics in Japan can be found by looking at patterns in occupational inheritance in other professions. In general, Japan has enjoyed a relatively high level of intergenerational social mobility since the end of World War II (Ishida, 1993), although descendants of the samurai and kazoku peers are still overrepresented among the highly educated and professional elites (Clark, 2014). Figure 2.8 shows the percentage of male respondents who reported having the same occupation and occupational field as their fathers (based on their fathers’ main occupation) in the Social Stratification and Social Mobility (SSM) survey, a nationally representative survey that has been conducted once every ten years since 1955. Naturally, there will be some reduction in occupational inheritance over time due to the introduction of new types of technologies and their concomitant professions, as well as the decline in agricultural workers. In addition, some professions, such as Shintō priest, continue to exhibit high levels of occupational inheritance.20
Nevertheless, the general pattern in Japan over the past several decades has been a decrease in occupational inheritance from father to son in most professions, even as occupational inheritance in politics was increasing. Moreover, as dynastic politics began to decrease in the 1990s and 2000s, occupational inheritance in other fields experienced a slight increase. In other words, the pattern in occupational inheritance across all professions is the opposite of that observed in the political realm. This suggests that changes in dynastic politics in Japan cannot be explained as part of a broader pattern in the labor market or a generational shift in Japanese society.
In sum, historical or cultural arguments are largely inadequate for explaining Japan’s dynastic politics. Each type of explanation lacks sufficient evidence in its favor and cannot explain the change in dynastic politics that we observe over time and across parties.
1. Some comparative work has made significant progress in collecting ties to local politicians. See, for example, van Liefferinge and Steyvers (2009), Chandra, Bohlken and Chauchard (2014), Querubín (2016), Geys (2017), Folke, Persson, and Rickne (2017), and Bragança, Ferraz and Rios (2015). For the case of Japan, there are 600 individuals who were related to a previously elected or appointed national-level politician (and so count as legacy candidates). If known ties to failed candidates are included, this number increases to 619 individuals. If known ties to local politicians are also included, the number increases to 721 individuals but likely undercounts many individuals whose local ties were not reported in newspapers or other media (particularly in earlier years in the data).
2. Studies of dynasties in the US context include Hess (1966), Clubok, Wilensky, and Berghorn (1969), Laband and Lentz (1985), Dal Bó, Dal Bó, and Snyder (2009), and Feinstein (2010).
3. In the Senate (not shown in Figure 2.1), the highest proportion of legacy members, 23 percent, occurred twice—first after the 1878 election and again after the 1916 election. Levels of dynastic politics in the Senate are higher than in the House of Representatives, but with fluctuations. The 115th Congress elected in 2016 included five legacy members in the Senate (5 percent), the lowest since 1792.
4. Department of Information Services, House of Commons Library. “Current MPs related to other current or former Members of the House of Commons.” Document SN/PC/04809, February 21, 2014.
5. Stanley, Tim. “Euan Blair for Parliament? Labour is more inbred than the North Korean politburo.” Telegraph, April 14, 2014. See also Savage, Michael. “Blair’s son shuns chance to run for MP.” The Times, January 1, 2015. The speculation is that Blair may wait until 2020 to make his entry into politics.
6. Cohen, Tobi. “Chow opens up on Layton’s final moments, vows not to seek NDP leadership.” Postmedia News, September 6, 2011.
7. The membership of the Five Star Movement is relatively young and new to politics. One member of the Chamber of Deputies, Cristian Iannuzzi, is the son of Senator Ivana Simeoni; however, they were both elected in the 2013 elections, so neither counts as a legacy MP. Another Five Star Movement MP, Azzurra Cancelleri, has a brother who is active in local politics in Sicily.
8. A mosaic plot is a type of stacked bar chart that is useful for visualizing the two-way distribution of two categorical variables in a single plot. The mosaic plots in this book were made in Stata with the spineplot package (Cox, 2008).
9. The number of seats held by the New Liberal Club between 1976 and 1986 (forty-nine) includes two affiliated independents: Hatoyama Kunio (legacy) and Ōhara Ichizō (non-legacy). Other legacy MPs in the party included Kōno Yōhei, Tagawa Seiichi, Nishioka Takeo, Kobayashi Masami, and Yamaguchi Toshio.
10. Sir Francis Galton (1886) noted the tendency of regression toward the mean in height across generations. Similar arguments about the talent and skills of the heirs to wealth were later made by the Scottish American industrialist Andrew Carnegie (1889).
11. This explanation is hard to test given the difficulty in measuring quality. During the SNTV era (1947–1993), however, the average tenure in office of candidates who directly preceded a son-in-law was seven terms, the same as for those who preceded a son. Thus, at least as far as length of tenure goes, predecessor quality is equivalent.
12. In total, there were 463 families who supplied two or more members as candidates between 1947 and 2014, and of those families, 373 were successful in forming a democratic dynasty. Note that determining the “boundaries” of different families can be a challenge because of intermarriage and overlapping branches of family trees. In cases of intermarriage between two dynasties, Table 2.1 reflects only the relationship to the individual who married into the family, not all other relationships connected through that marriage (which are counted in the other dynasty). Some legacy candidates would actually count as having succeeded a larger number of relatives if such distant relatives were to be included. The numbers of generations given in Table 2.1 may thus be less precise when there have been multiple politicians in the dynasty.
13. The scandal was not simply that he had an affair with the geisha, but that he was stingy in providing financial support for her services (West, 2008).
14. The exception is legacy MPs whose relatives previously served in cabinet. Such cabinet legacies tend to have higher levels of education than other legacy MPs and non-legacy MPs. This distinction between types of legacy MPs is explored in Chapter 6.
15. Information on the educational backgrounds of MPs elected in 2014 is from the replication data for Horiuchi, Smith, and Yamamoto (2018a).
16. Tokugawa Tsunenari (2009, p. 117), the eighteenth head of the Tokugawa lineage, explains how the education system reinforced the rigid occupational structure of Tokugawa Japan: “Each child would use a textbook suited to his father’s occupation, to which he was expected to succeed in the future. There were around seven thousand different textbooks in Tokugawa Japan.”
17. Imperial appointees to the House of Peers included personal appointments at the discretion of the emperor, representatives of the highest taxpayers, and representatives from the Imperial Academy.
18. These elected members of the House of Representatives attempted to introduce increased popular rights and party-based cabinet politics, but were blocked by oligarchs who controlled the House of Peers and the Privy Council. Their efforts were made all the more difficult because the parties during this period—including the two main parties in the House of Representatives, the Seiyūkai and the Kenseikai—were internally divided and unstable. Nevertheless, the period of time between the end of the Russo-Japanese War in 1905 and the assassination of Prime Minister Inukai Tsuyoshi and subsequent fall of the Seiyūkai party cabinet in 1932 is generally referred to as the period of Taishō Democracy (named after Emperor Taishō, who succeeded Emperor Meiji in 1912 and ruled until 1926), as it seemed as though the development of party politics was beginning to give greater democratic voice to the common man.
19. Wallace, Bruce. “Japan’s dynasty politics losing favor among the public.” Los Angeles Times, January 22, 2008.
20. A useful statistic is the odds ratio. If greater than 1 for any particular occupation, it indicates a level of occupational inheritance, and larger odds ratios indicate a greater association between father’s and son’s occupations. In the 2005 wave of the SSM, the odds ratio for engineering professions is roughly 6; for teaching, it is 10; for farming, 13; for medicine, 27; for military, 166; and for priests, it is 1,234. Unfortunately, there are not enough politicians among the SSM survey respondents to compute similar odds ratios for politics.